Introduction

This website has been created in order to present the Final Project of the Social Graphs & Interactions course, provided by Technical University of Denmark, Copenhagen. The project had to be carried out in group, and in general, it expected to conduct an analysis on an interesting dataset, whose choice was up to us. As it is already clear from our Home, ours focused on The Lord of the Rings universe. Hence, we conducted an in-depth analysis taking in consideration different sources. Starting from our dataset, we wanted to extract some curious results, hidden statistics or secrets and bring them to light, such that the most passionate fans of this universe could (we hope!) be satisfied, but even people who don't know anything about it could appreciate and discover a huge fantasy world. A world that, at first, through epic books, then through unforgettable movies, caught the attention of lots of fans and achieved a worldwide success.

Just before you go on, a few tips to fully enjoy your journey through the Middle Earth: the purpose of the website is that is must be explored with a natural flow, such that its contents are ordered from the top to the bottom. It doesn't include any technical explanation which instead can be consulted in detail with the complete Jupyter Notebook. Enjoy your reading!

P.S. You don't know anything about The Lord of the Rings? Fly, you fools!, as wise Gandalf would say... We can briefly say that The Lord of the Rings (frequently shortened in LOTR) was born as a famous trilogy of fantasy novels written by J.R.R. Tolkien in 1954, then brought to cinemas in the beginning of the 2000s by Peter Jackson. The movies achieved an incredible success such that LOTR became an official brand with its own merchandise. For further explanation, see on Wikipedia.

What you will see

Network

Starting from the "One Ring to Rule Them All!" Wiki we downloaded a XML copy of all the pages and extracted the relevant contents, built a network of all the characters, places and battles and conducted an in-depth analysis using Python.

NLP

The acronymous "NLP" stands for Natural Language Processing: this means that, starting from a huge quantity of text extracted from those pages representing the nodes of the network, we analyzed it and provided some curious facts.

Books and Movies

We all know how huge the books of the trilogy are (the whole book The Lord of the Rings is 1000+ pages!) and how long the movies are (each of them lasts more then 3 hours!)... Hence, we wondered whether there are clear differences or similarities in terms of specific topics, like sentiment analysis and character mentions.

Ring

The Dataset

As well as every project or research involving data, we needed a dataset to start from. Here there is a brief explanation of what we used and how we managed to extract information from it.

From a XML file...

The first network generated from the pages of the Wiki was built using this dataset, which provides, through a well-formatted XML file, the whole content of the Wiki. The size of the dataset is around 50 MB. We extracted the relevant information from the XML file and generated a network of characters, cities and name of battles, where all these represent nodes, while the links (edges, in a formal network syntax) are represented by the Wiki links inside each page. Wiki links are nothing but simple links with a specific syntax commonly used by many Wikis including the most famous Wikipedia.

To HTML pages...

By the other hand, we needed some way to have a digital version of the books, and the scripts of the movies. Fortunately, this wasn't hard to achieve, since Internet is always the most reliable resource: we found the first, the second and the third book. We downloaded the HTML content of the pages, cleaned them and had them ready to analyze. Meanwhile, we also found the movie scripts: again, here the first one, the second one and the third one.

and Basic Stats

  • Number of nodes of the network: 653
  • Number of total links of the network: 3971
  • Number of isolated nodes1: 43
  • Average degree: ~12
1. Pages that didn't have any link related to any other of the pages of the subset we took in consideration, and none of the latter have links to the former.

Wiki Network Analysis

What does a network of LOTR look like? We hereby provide some "nice" plots to show it.

Full Network v.1

The whole network with node size and color by degree

Full Network v.2

The whole network, highlighting the different categories of nodes

Giant Connected Component

The GCC is the biggest subgraph (in terms of number of nodes) without isolated nodes

Centrality

The centrality of a network is an important parameter to identify crucial nodes of the network. We took in consideration two types of centrality and the degree of the nodes in order to identify the most important nodes of the network. Why these three parameters? Actually the importance of a node isn't that immediate, that's why we took in consideration different parameters such that we could compare the results and infer our conclusions.

  • Betweenness Centrality 2: is an indicator of a node's centrality in a network. It is equal to the number of shortest paths from all vertices to all others that pass through that node. A node with high betweenness centrality has a large influence on the transfer of items through the network, under the assumption that item transfer follows the shortest paths.
  • Eigenvector Centrality 3: is a measure of the influence of a node in a network. It assigns relative scores to all nodes in the network based on the concept that connections to high-scoring nodes contribute more to the score of the node in question than equal connections to low-scoring nodes.
  • Degree: the degree of a node is a number that indicates the number of nodes it's connected to (or, the number of links connected to it). We can identify the in-degree and out-degree, which identify respectively the number of in-edges and out-edges.
2 and 3: From Wikipedia

Top Degrees

The nodes with the highest degree

Top In-Degrees

The nodes with the highest in-degree

Top Out-Degrees

The nodes with the highest out-degree

Eigenvector Centrality

The nodes with highest eigenvector centrality

Betweenness Centrality

The nodes with highest betweenness centrality

Hmm, interesting...

Ok, for those who didn't guess it yet, the Lord of the Rings is definitely Sauron. His extremely high degree means that his name leads to other 156 other pages in the Wiki, and as we can see from the in-degree his page is highly mentioned by the other pages! Much more than how many other pages he refers to. High rankings also for different members of the Fellowship of the Ring. There are some curious results, involving Aragorn for example: his page has a high out degree but he's not in the top 10 highest degree ranking... The role of Galadriel, the famous Elf Queen, seems to be central in the whole universe according to her degree.

Sauron again holds the record that sees him as the most central character in the whole network; again, we see some names in common with the degree rankings, and high scores for Aragorn,Legolas, Witch-King of Angmar and (unexpectedly?) Isildur. Places like Minas Tirith and Rivendell also play a central role. Last but not least, no Frodo Baggins in the centrality rankings...

Degree Distribution

What is the degree distribution? It's a plot where it becomes clear how many nodes in the network have a specific degree, and if this has a particular trend. We're going to show the distribution separated for in-degree and out-degree, because the results we got are more interesting if we compare them.

In-Degree

Distribution of the in-degree values of the nodes in the network

Log In-Degree

Logarithmic istribution of the in-degree values of the nodes in the network

Out-Degree

Distribution of the out-degree values of the nodes in the network

Log Out-Degree

Logarithmic distribution of the out-degree values of the nodes in the network

What do these plots mean?!

The linear plot show a pretty much regular trend, much more evident in the in-degree distribution: commonly, this trend has been called power-law, and the main feature is that there are a lot of nodes with a very low degree and just a few nodes with a very high degree. This is basically why we also plot the logarithmic version, such that it gets even more clear the relation between the increase of the degree and the decrease of the frequency. Why does this happen? Basically it's because the more a page is cited, the more famous.

A few more words are worth to be spent for the out-degree distribution: the general trend seems to follow pretty much well the one for the in-degrees, but the noise is much worse. Why all this noise? The out degrees seem to follow a slightly random law (still, mainly following a power law distribution). For example, a peak in the 0 value is the same of the power law distribution, but the maximum degree is very low if compared to the one of the in degrees. On the other hand, the logarithmic plot shows a distribution that is as like as the random one, still following an almost-linear decrease as the power law predicts. This makes perfectly sense: in a real network, there are hubs that, once are growing, keep receiving links (i.e. citations). In this case, once a character/battle/place gets a lot of citations, it becomes more famous (or, more probably, he is already famous) so it gets more citations. This brings the in-citations to follow a power law. On the other hand, if the page of a character/battle/place cites a lot of others characters/battles/places (outbound links), this does not always mean that the former is famous, or that in the future he will more likely have other pages cited in his page. As a consequence, the out-bound links distribution looks like a power law with random noise in it.

Community Detection

Is it possible to aggregate in groups (formally, communities) the nodes of the network? According to which criteria? We wondered what was the best way to actually find these communities, and our natural intuition was to group them by race. The race is an important parameter that (almost) every character has and we thought that maybe a lot of characters from the same race are well interconnected to each other (this is what a community is meant to be). Hence, our analysis went on, and we started by calculating the communities with an already built-in function (called the Louvain algorithm) that tries to extract automatically the communities for us. We hereby provide the results of this analysis.

Communities v.1

A plot that shows the whole network with a clear division by color between the communities

Communities v.2

Logarithmic istribution of the in-degree values of the nodes in the network


It's clear that the communities were pretty much well identified, since there are just a few communities with very few nodes (as the second plot clearly shows), while most of them are relatively high populated. Still, we don't know with what criteria they have been identified, and we wouldn't have known that without trying our own implementation of the algorithm for the community detection. So, as we already mentioned, we tried to detect the communities categorizing the nodes by races. We don't show again the plots, instead a useful comparison tool between two different sets of communities: a confusion matrix. Please, don't be worried by its name! It's just a very simple matrix, where each entry (i , j) (where i identifies the rows and j the columns) is a number that identifies how many nodes the race number i has in common with the community number j (where by races and communities we identify respectively our own categories and the Louvain algorithm communities).

Confusion Matrix

A "clear" comparison between the different algorithms of community detection


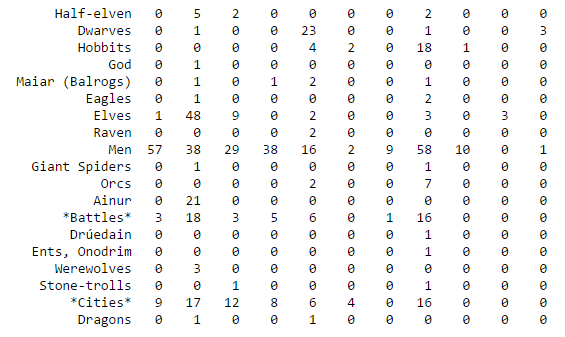
The secret behind all those numbers is quite simple: as already mentioned, each row identifies a race, and each column a community. To what degree each race well corresponds to a particular community? It's much easier to understand this with an example. Look at Dwarves row: they have 23 common nodes with the 4th community (remember that indexes start from 0!), and just 0-1 common nodes with the other communities (just one with 3). This is a clear example of well defined community based on the race. Even better the case of the Ainur, who have all their nodes in common with one single community! By the other hand, race of Men is a clearly shows that they don't aggregate well to each other, since they are much more scattered in multiple communities. It's worth saying that, since the original network included battles and cities as well, they are part of the community detection algorithm, and the matrix shows that, if you look at both their rows, they kind of have some similarities: they probably might create a community all together!

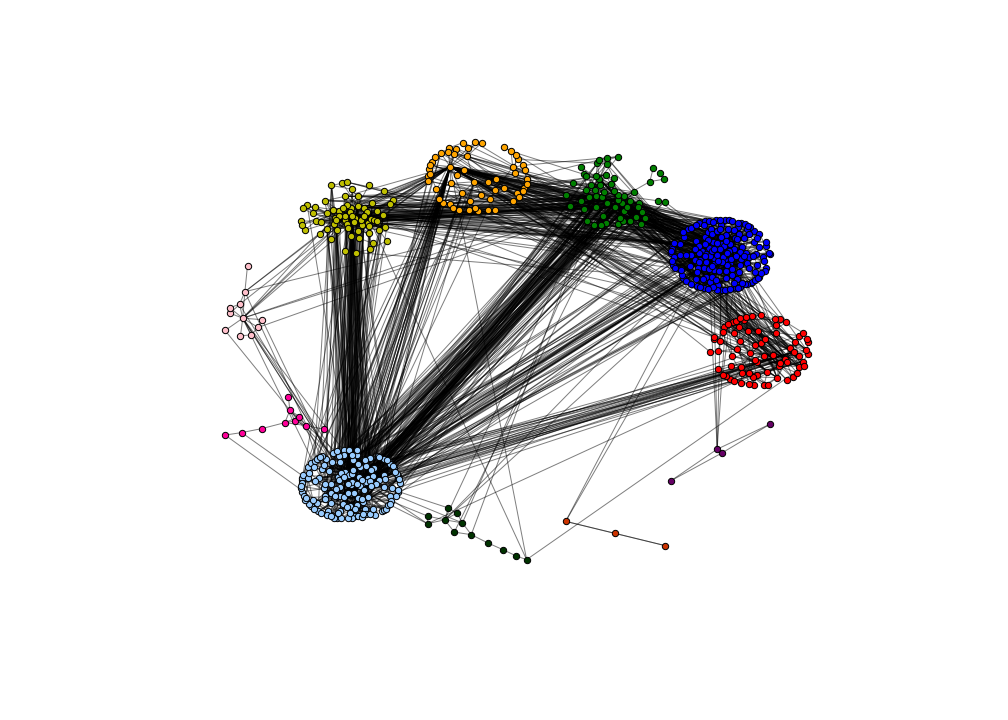
In a more scientific way, there is a parameter that is usually took in consideration in order to evaluate to what degree the communities are well defined. Hence, we calculated this parameter, which is known as modularity, both for the Louvain community detection and our version of the algorithm.

  • Louvain algorithm 11 communities, Modularity = ~ 0.74
  • Races algorithm 19 communities, Modularity = ~ 0.33
Yes, ok, let's make it easier... Just keep in mind that the higher the modularity, the better the community are well defined. In conclusion, race might be taken in consideration, but for sure it's not the only thing that marks the different communities.

In-Depth Wiki Text Mining

Now it's the moment to stop for a while with pure network analysis and to put some text in it! We extracted the text of the pages in the Wiki and created some cool stuff for your viewing pleasure. Basically this part was splitted in two big subsets: shortest path similarities and wordclouds.

Average Similarities 4

The shortest paths of the network are the paths (represented through a list of nodes from a source to a target) that take the lowest number of steps to be followed. We wondered how much the pages that represent each shortest path have similar content. We generated 5000 random paths and what we achieved is that usually it's quite common to find a path with very low average similarity between its nodes<.

Shortest Paths Similarities

The distribution of the average shortest path similarities

Word Clouds

What are the most commond words related to each character? Or to each city, battle, race? We worked on the text extracted from the wiki pages, cleaned and processed them and figured out which are the most frequent and characteristic words. In this website we reserved a whole section for these nice pictures, so you can easily filter them and see the ones you're most interested in.

Population Analysis

We extracted some features from the Wiki pages and provided some interesting results in terms of population and especially for female characters. What is the role of females in the LOTR universe? How many of them appear? How are they distributed among the races? Who are the central female characters of our network? Below you'll see how we tried to provide an answer to these questions.

The average similarity is nothing but a relative score that marks each path, through a specific algorithm, in order to state how much the content of the pages related to the nodes are similar to each other. Actually the values we achieved cannot be compared, so we actually state they're low according to their trend: just a few paths have high average similarity (~0.53), while most of them are between 0.1 and 0.22. This is a common feature of many Wikis, since often in the Wiki pages there are some wiki links (represented by the edges in our network) that are not coherent with the content of the pages (nodes) they are linking.

Word Clouds

Aragorn

Arwen

Boromir

Legolas

Elrond

Frodo

Gimli

Gollum

Gandalf

Sauron

Race of Men

Race of Elves

Race of Dwarves

Race of Hobbits

Places

Battles

Population Analysis

Have you ever wondered the role of female characters in the LOTR universe? Hereby some interesting facts we extracted and plotted in an user-friendly way!


Gender Stats v.1

Gender Stats v.2

A pie-style plot of gender distribution

Races and Gender

How many males/females for each race?

Females Network


We found out that Galadriel seems to be the most central female in the universe of LOTR, according to her high degree and betweenness centrality.

Books & Movies Analysis

Books and movies are the second but most interesting part involved with text mining, even if we actually treated it in a different way... What we basically worked on is an accurate comparison between the movie scripts and the books, and extracted a lot of curious results!


Movie Networks

We created two other versions of networks based on the character mentions and on characters in the same scenes. Hereby some cool pictures with the data we analysed.


Here the network based on characters in the same scene:

Graph Plot

Top Degrees

Top degree values for the network

Betweenness Centrality

Top values of betweenness centrality

Eigenvector Centrality

Top values of eigenvector centrality


And the network based on character mentions:

Graph Plot

Top Degrees

Top degree values for the network

Betweenness Centrality

Top values of betweenness centrality

Eigenvector Centrality

Top values of eigenvector centrality


Let's show some basic stats about the above networks.

  • Dialogs Network 102 nodes, 529 edges
  • Mentions Network 97 nodes, 272 edges
As we can clearly see, the characters of the Fellowship of the Rings came back to the top-positions in all the rankings. Theoden gains an unexpected position in the top degree values! However, his role as King of Rohan makes him interact with a lot of people throughout the movies, which makes this more reasonable.

Words Statistics

With such a huge quantity of text, do you think we wouldn't ever wondered about how much some specific words are used throughout the whole movies and books? Below you can find some plots known as dispersion plots, which provide a temporal overview (where actually the x-axis simulates the time, based on the length of the script/book) and with blue bands identify when a word appears.


Books Dispersion Plot

Movies Dispersion Plot

Gollum's Books Dispersion Plot

Gollum's Movies Dispersion Plot

Of course they're not, as we said these plots must be read carefully in order to understand the differences between the movies and the books. We strongly recommend to compare and see how many curious differences are revealed: first of all Frodo. Enjoy!

Sentiment Analysis

Sentiment analysis is probably the most interesting text mining feature we could perform on books and movies of this awesome universe. Again, it provides very nice results comparing how much the sentiment of the books and the movies differ from each other.


Bars Sentiment Plot

Sentiment Plot #1

Sentiment Plot #2

Sentiment Plot #3


No rainbows at all! Just keep in mind that the first picture shows a bars version of the sentiment analysis, where red bars correspond to negative sentiment and the green bars correspond to positive sentiment. By the other way, the other plots provide just an alternative version, which must be read like this: high peaks correspond to positive sentiment, low peaks to negative sentiment. As we can see, there are strong differences especially starting from The Two Towers.

Explainer Notebook

Are you brave enough to see how all of this was achieved? If yes, you can see our fully explained Jupyter Notebook, written in Python. Enjoy and thank you for your reading!